Private AI · statistical analysis

The private AI data analyst for researchers.

Ask a question in plain English. It runs the real statistics on your own computer — nothing uploaded, every number checkable, and a reproducible record for your paper.

100% offline· Visible evidence· Reproducible exports· 100+ analyses
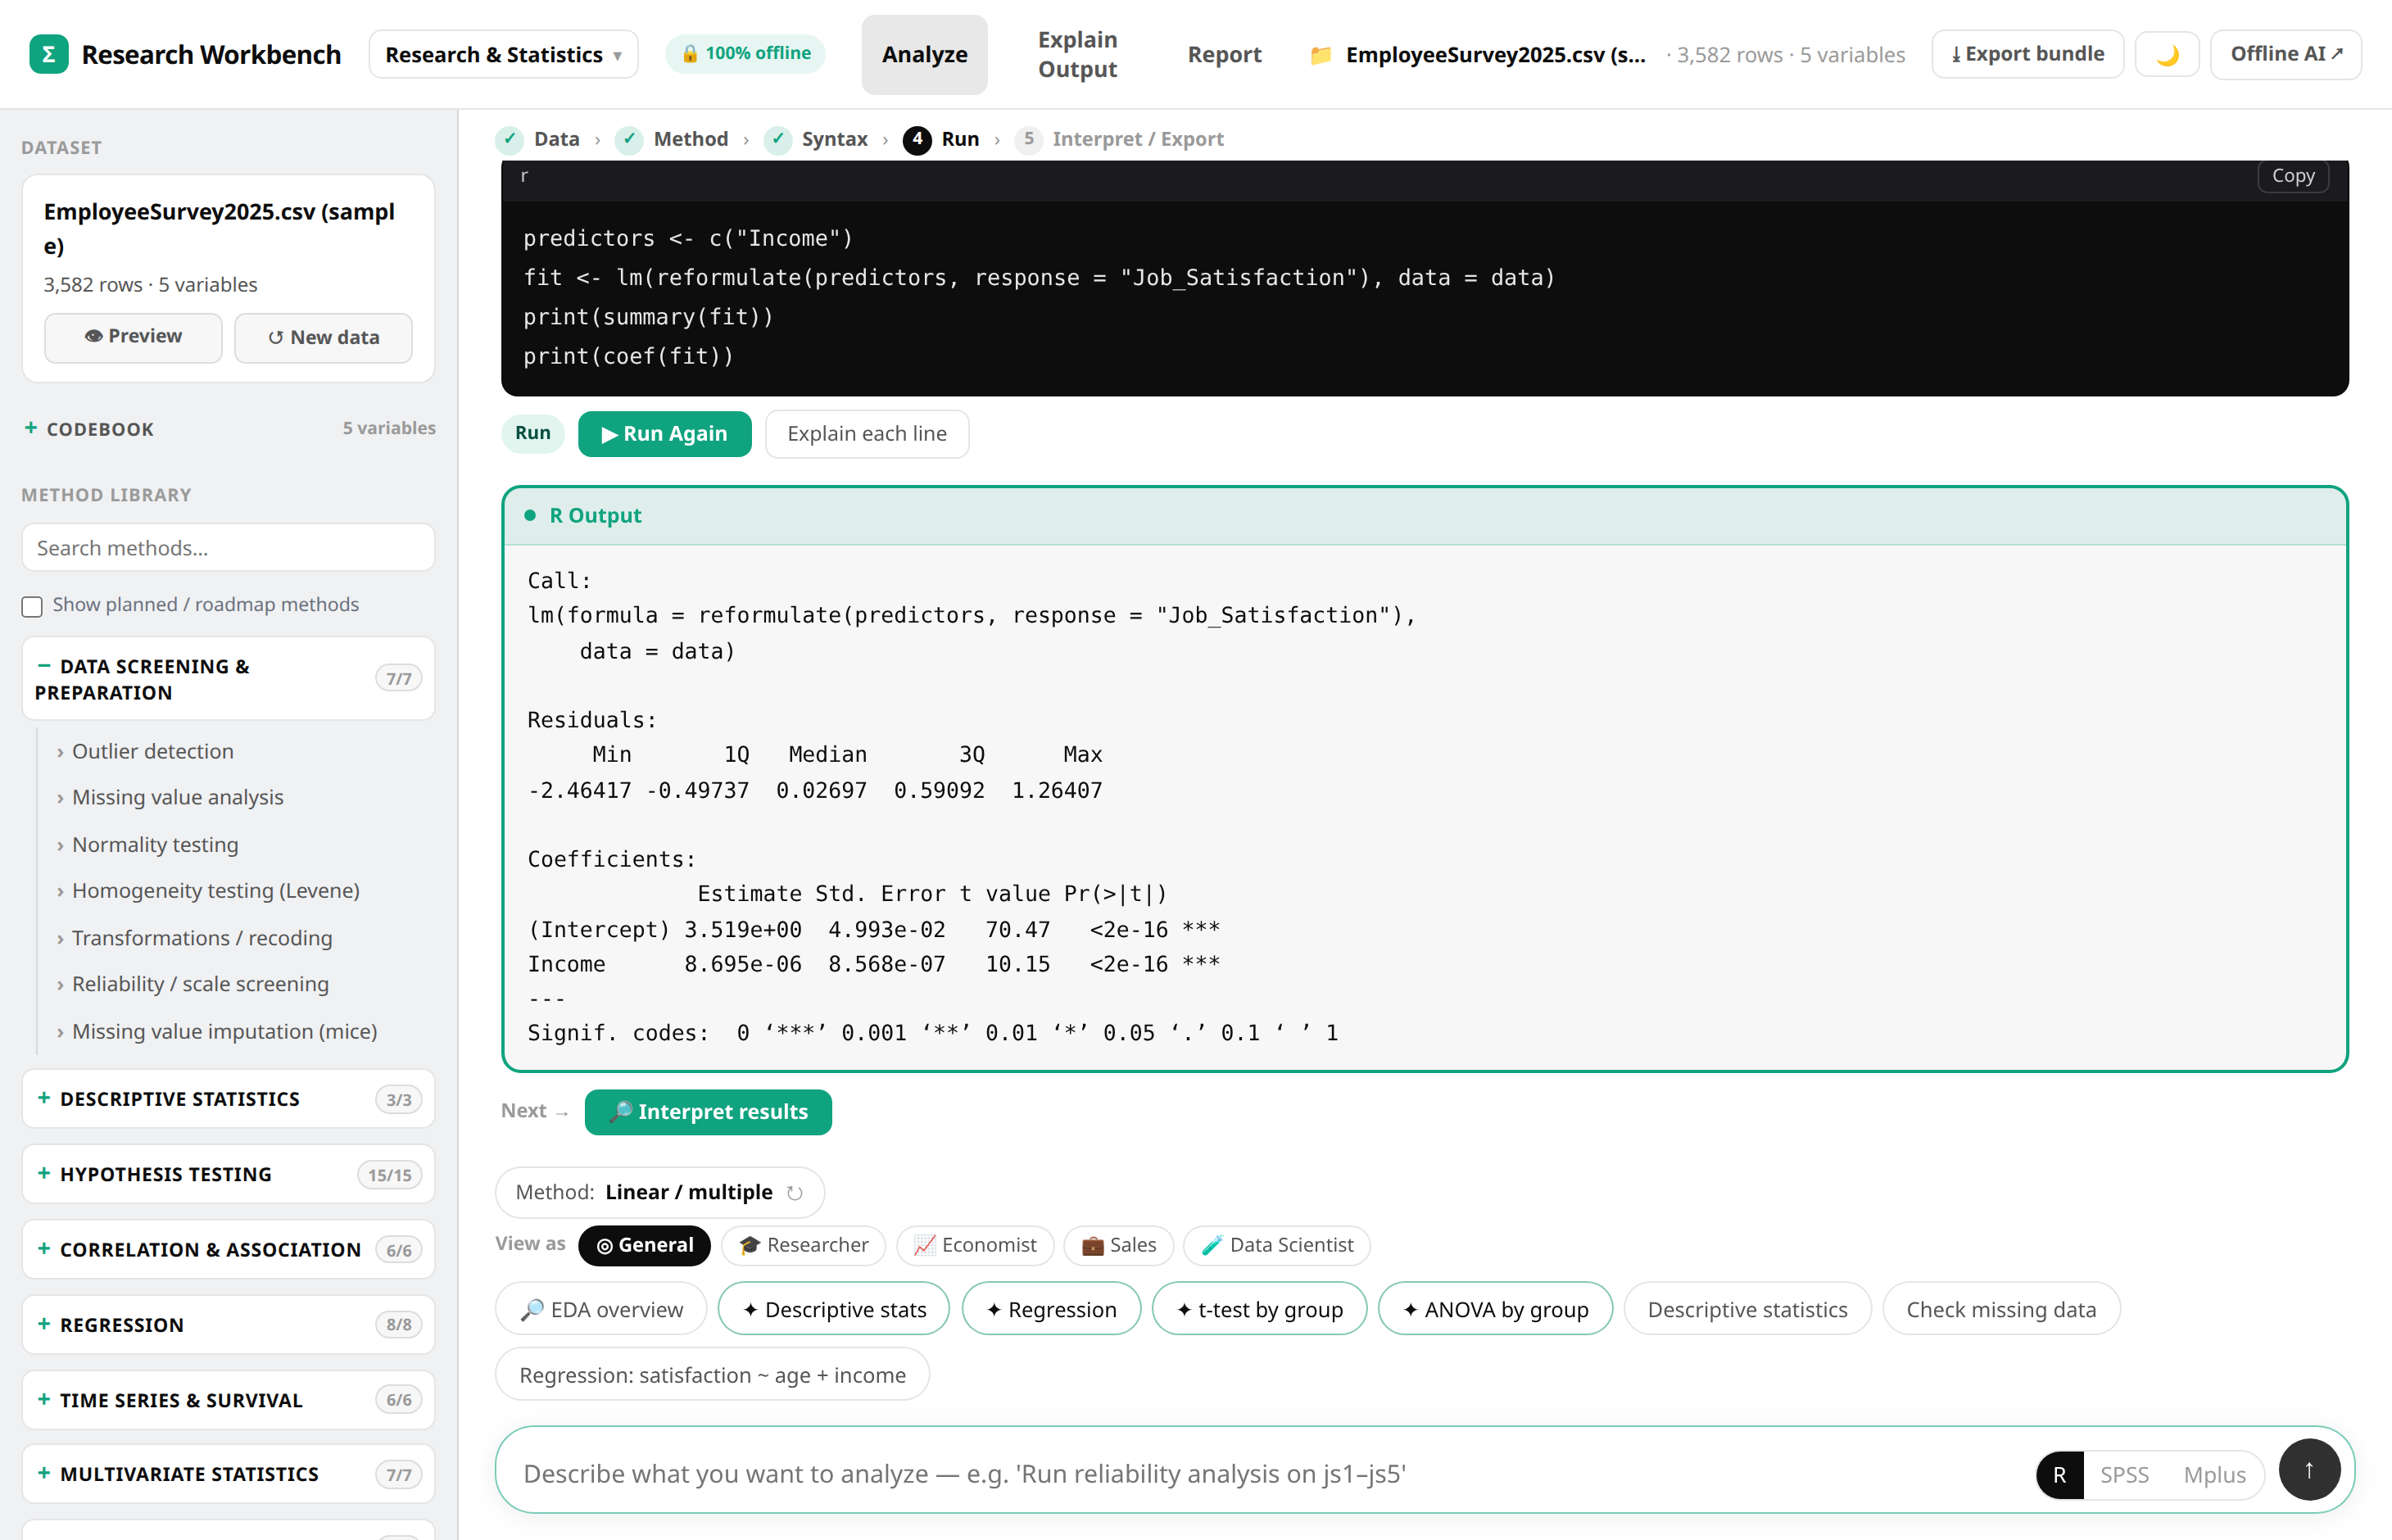
The OfflineAIBox research workbench: a plain-English question runs a real regression with a verified R output panel

BUILT FOR TEAMS WHOSE DATA CAN'T GO TO THE CLOUD

ProfessorsGrad studentsResearch labs ClinicsEthics-governed dataNDA projects
How it works

From a plain question to a result you can defend.

No statistics degree, no cloud account, no data leaving your building.

1

Load your file

A spreadsheet or survey from your own machine. It stays there.

2

Ask in plain English

It picks the right method and writes the analysis for you.

3

It runs locally

Real R runs on your computer — not in the cloud.

4

See the proof

The answer, the exact figures, and the code behind them.

5

Export

A publication-ready write-up and a reproducible record.

Just ask

Type the question. Confirm the method.

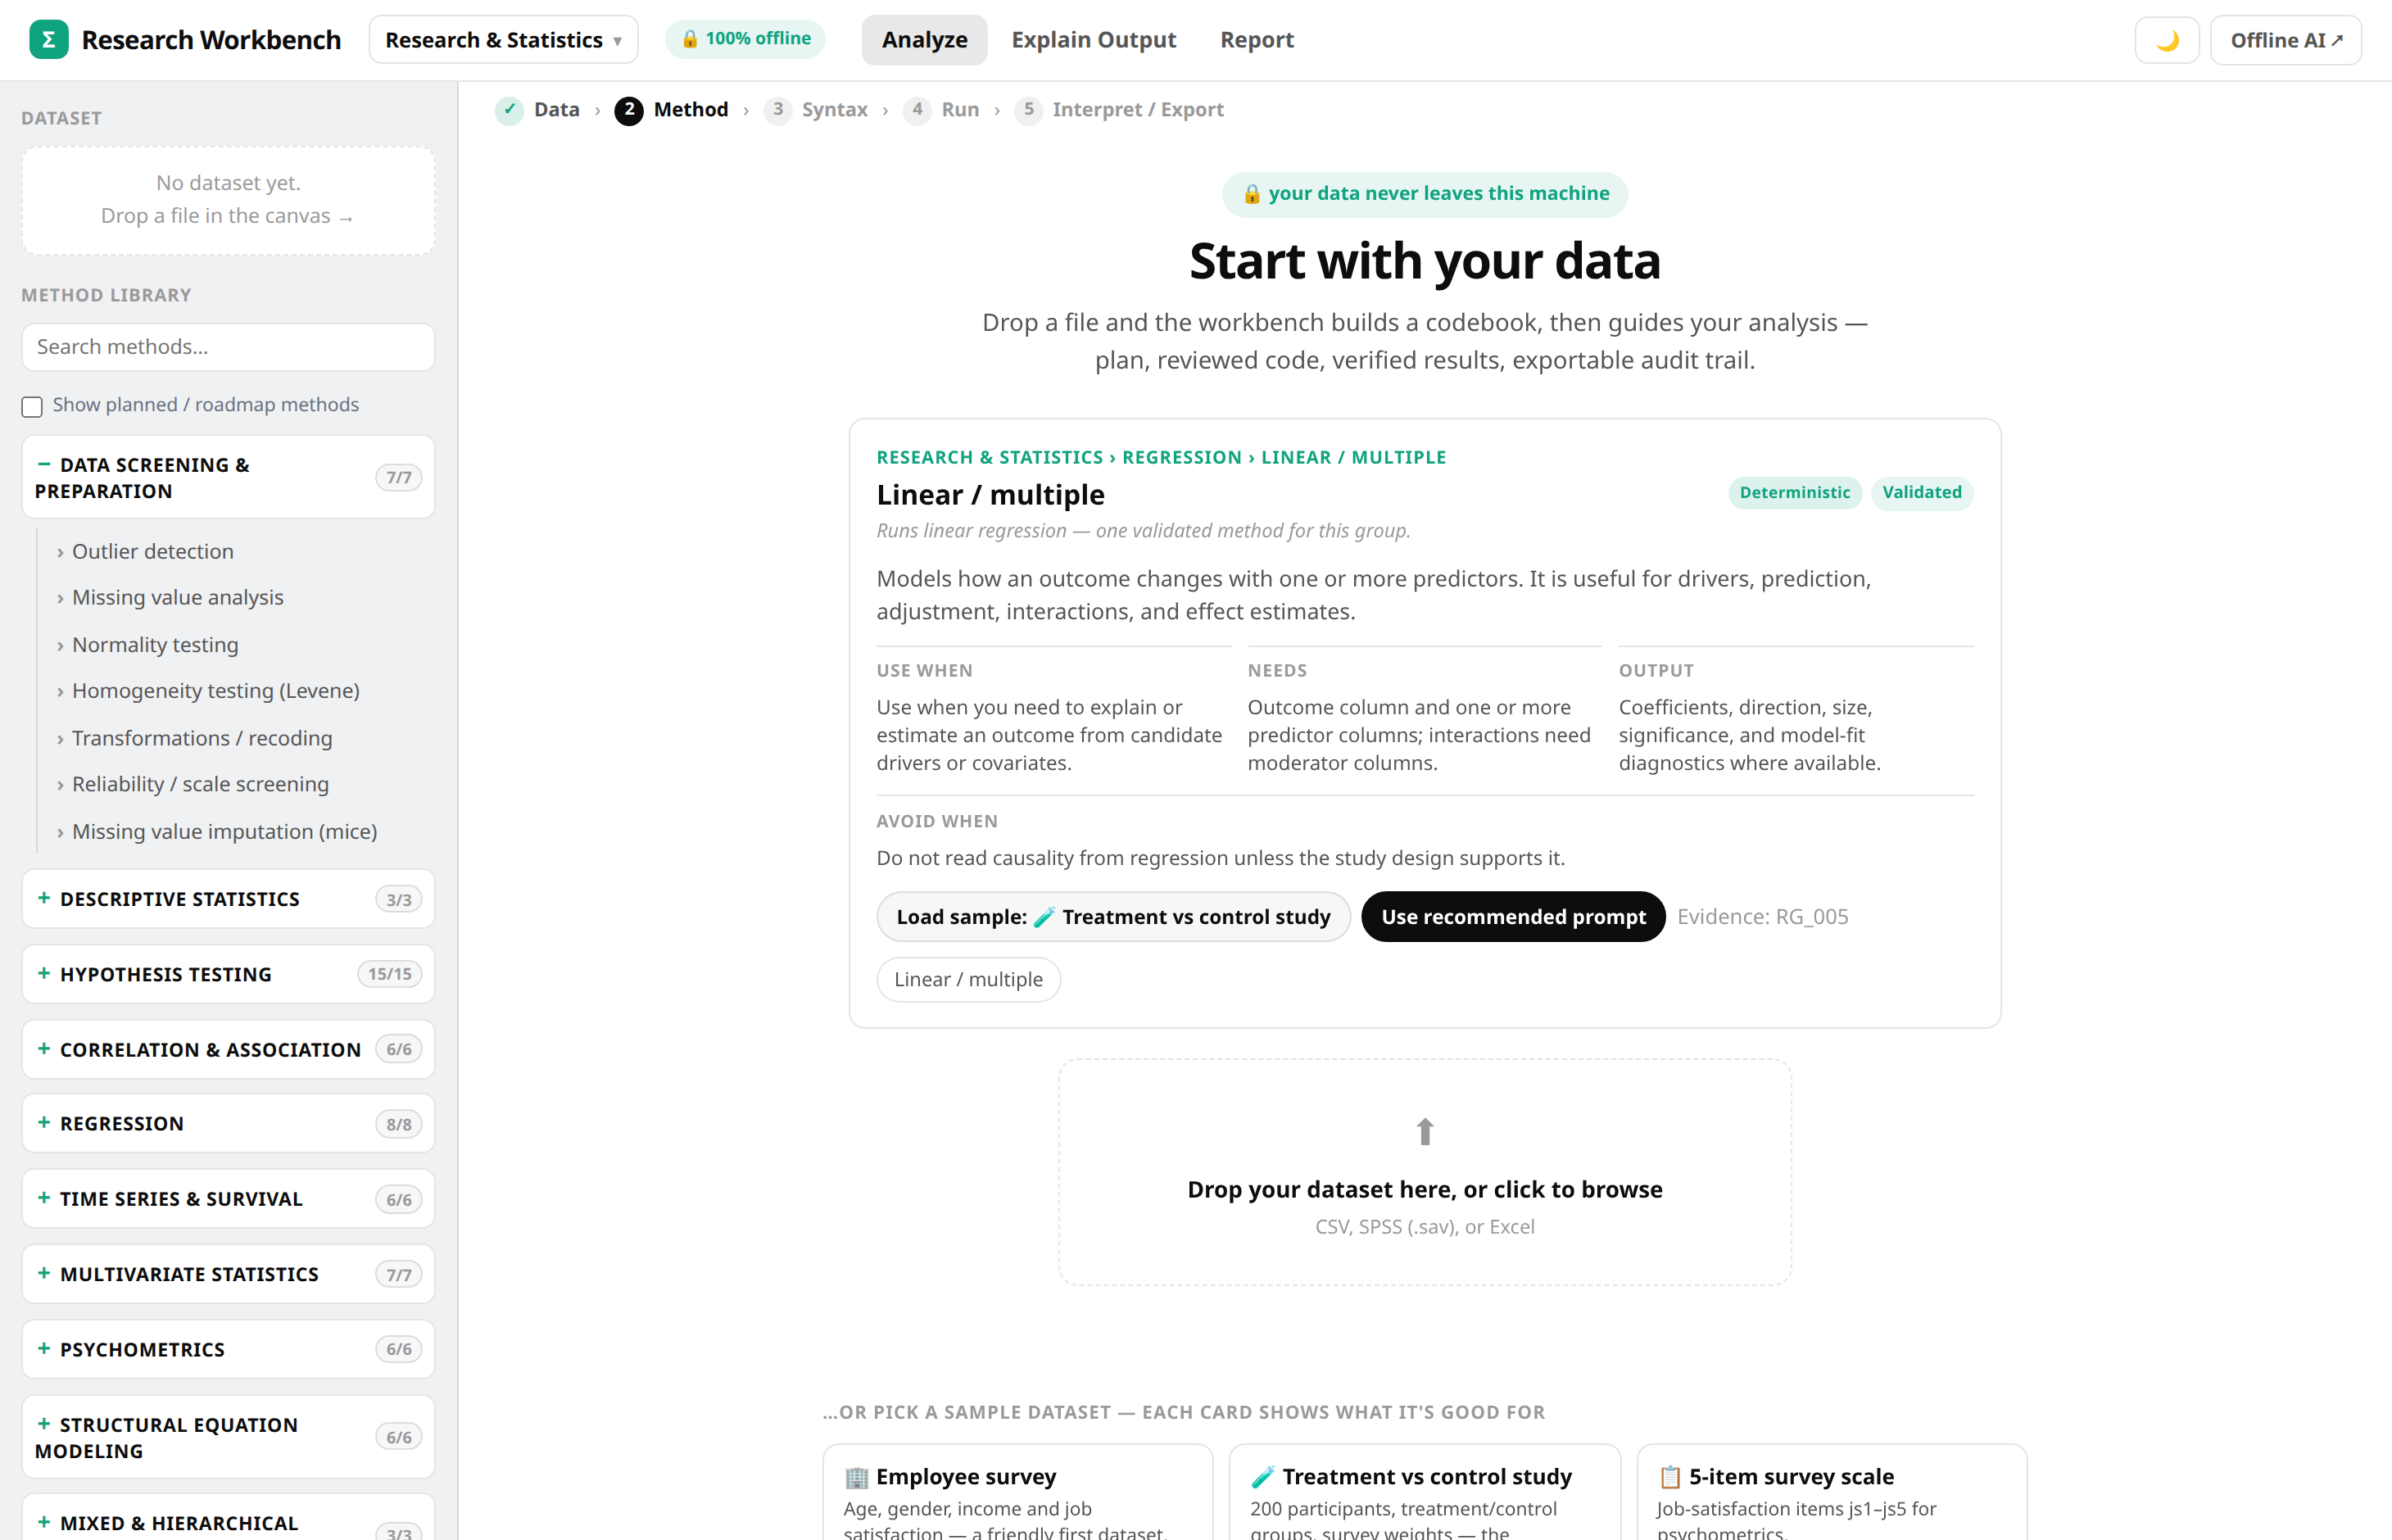
Forgot whether it's a t-test or an ANOVA? You don't need to start with the method name. Describe what you want to find out; the workbench proposes compatible methods and columns for you to confirm, then writes the R and explains the result.

  • A plain-language guide for every method — what it does and when to use it
  • Recommendations that actually fit your columns
  • 100+ analyses, from t-tests to mixed models and SEM
A method guide card explaining a regression: use when, what it needs, expected output
Private by design

Nothing ever leaves the machine.

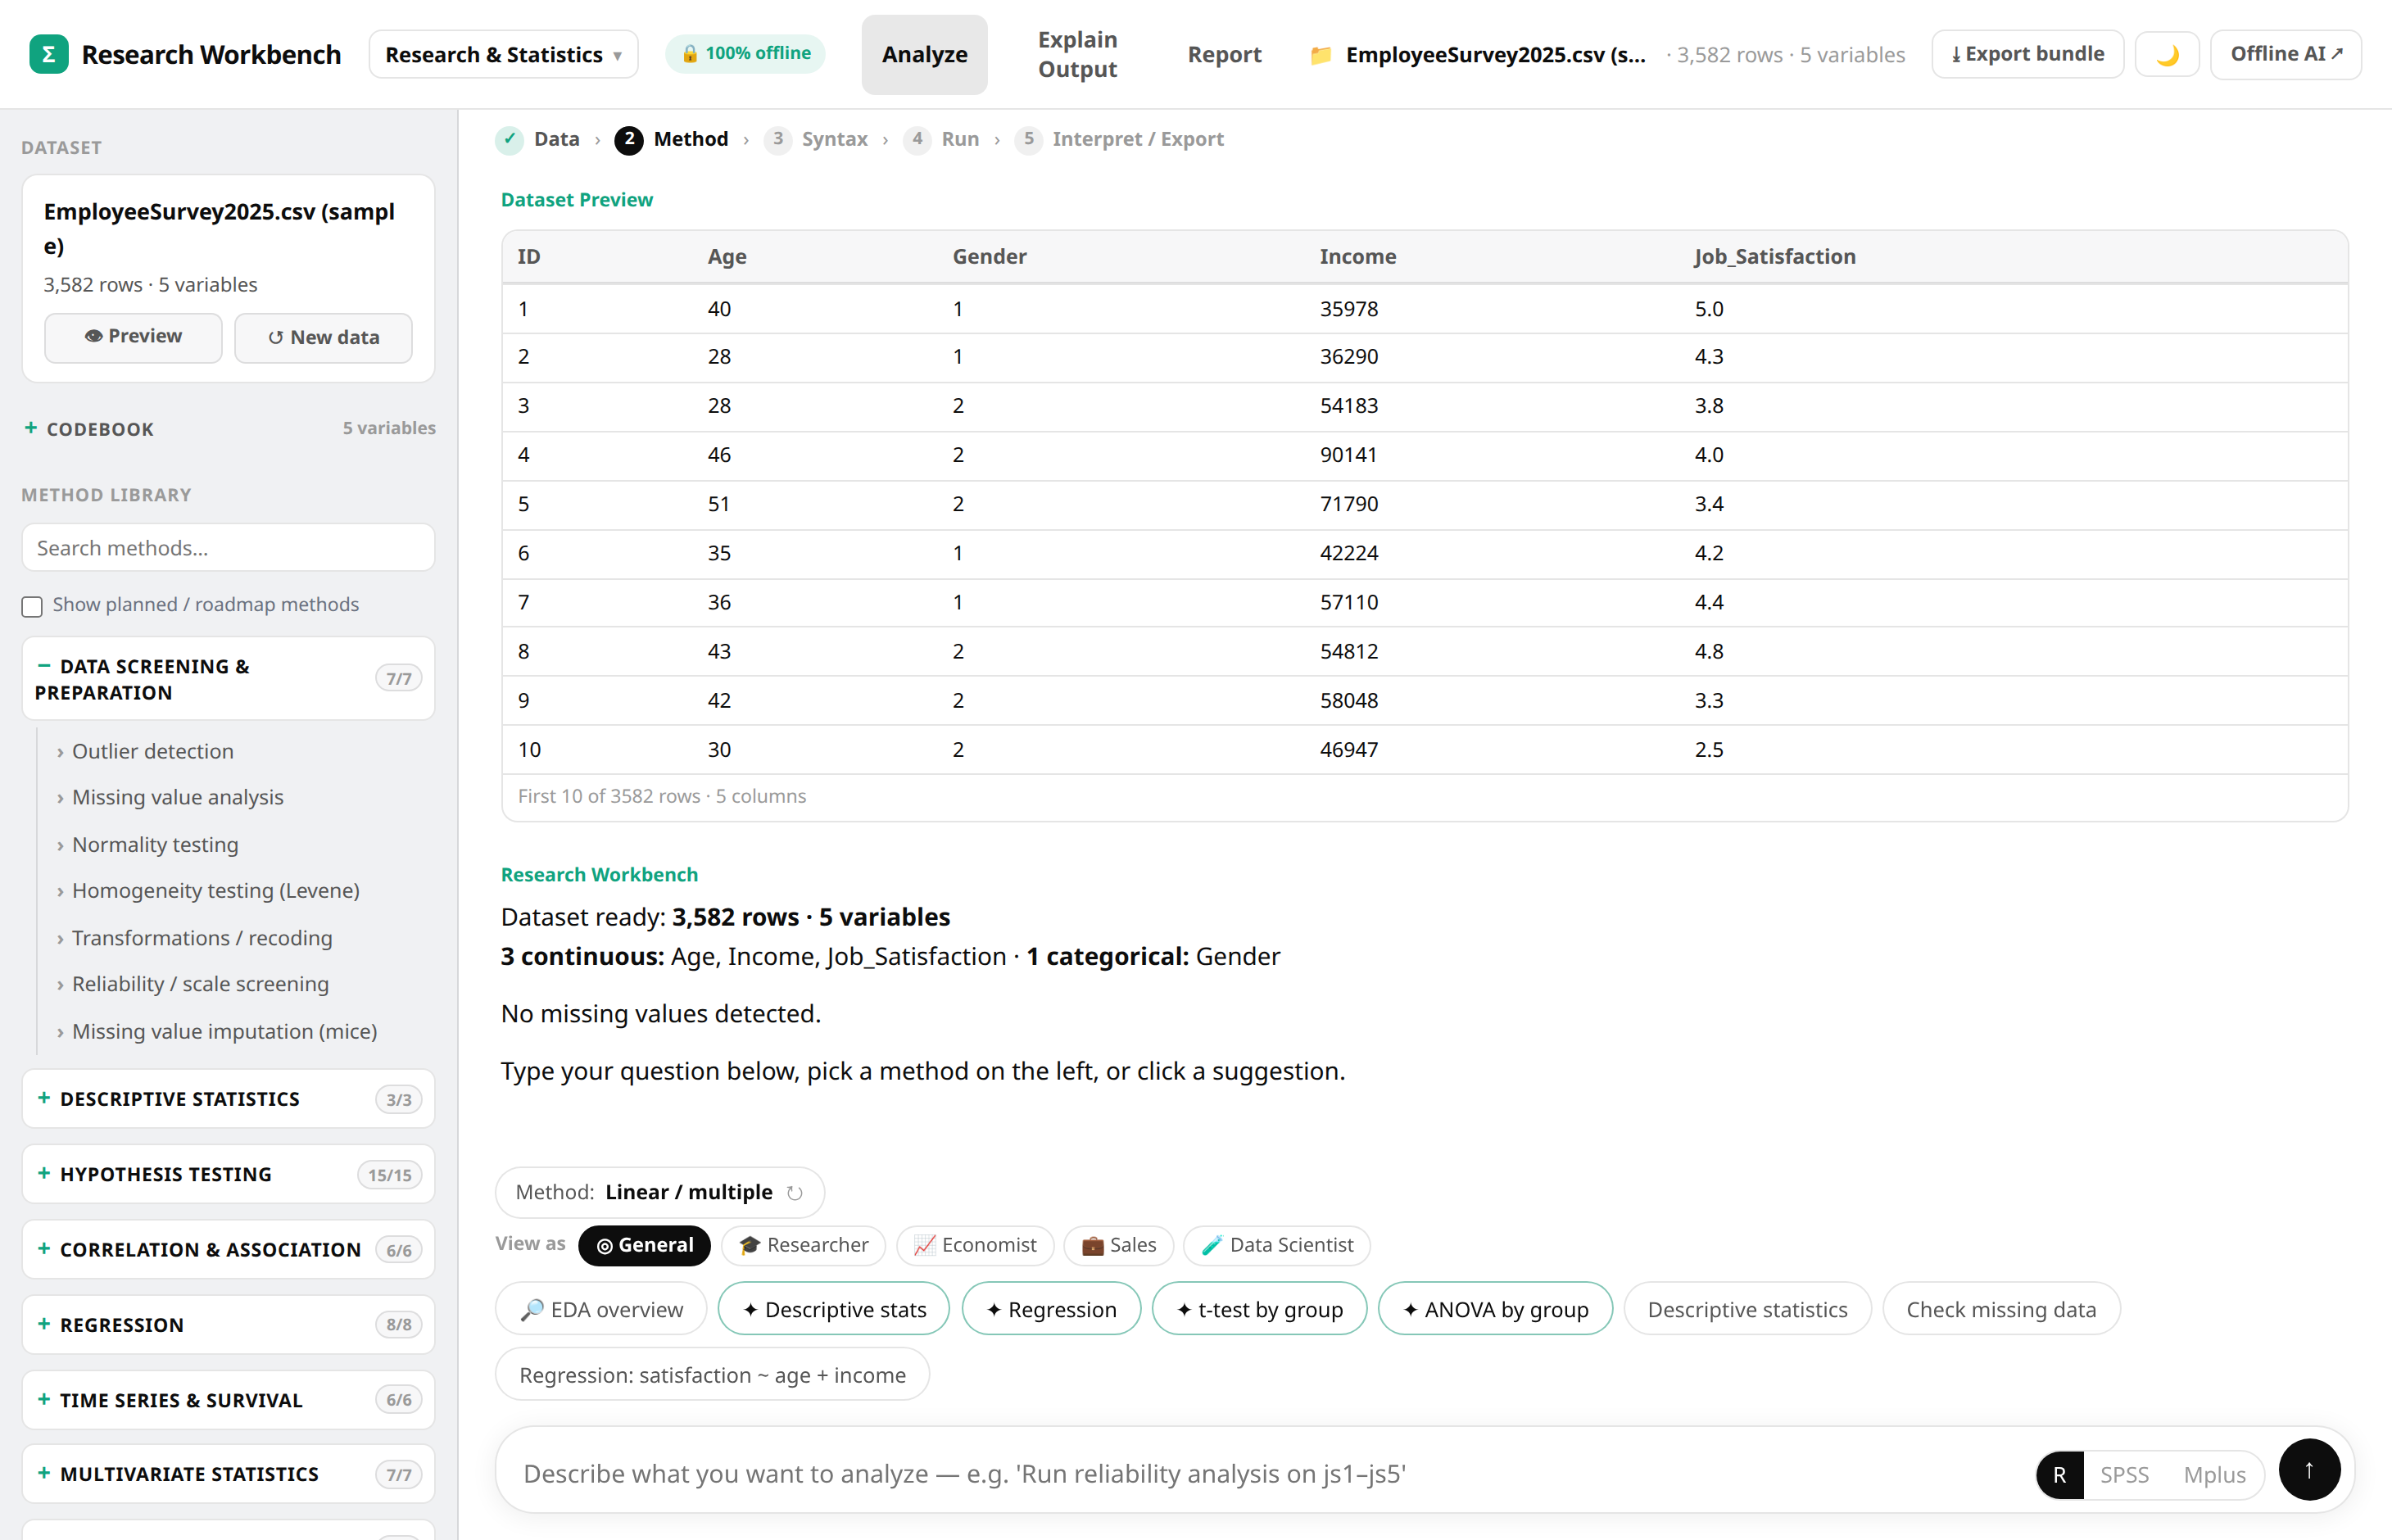
Your data is read and analysed on your own computer. You can pull out the network cable and it keeps working — the simplest proof of privacy there is. Perfect for REB/ethics-governed and NDA data.

  • 100% offline — no uploads, no cloud account, no telemetry
  • Unlimited local files — no token or upload limits
  • Runs on a Mac, a workstation, or a small office server
A dataset loaded locally with a preview and suggested analyses, marked 100% offline
Trust the numbers

Answers you can check — not just believe.

Most AI tools ask you to trust them. This one shows its work: the columns it used, the code it ran, and the real output every figure came from. If your data doesn't fit, it says so instead of inventing a result.

  • Every number traces back to the actual computation
  • It shows exactly which columns filled each role before running
  • Export the script, output, and a data fingerprint to reproduce it
A completed regression: generated code plus a verified results panel with the real numbers
Why OfflineAI

Keep the guidance. Keep the statistical evidence.

OfflineAI combines the approachable guidance people expect from AI with the explicit state, execution, diagnostics, and reproducibility needed for serious analysis.

Why not rely only on public AI?

Conversation alone is not a durable or reproducible analysis record.

Public AI limitationOfflineAI design response
Conversations can become long, stale, or lose analysis contextDataset, method, bindings, code, and results are tied to an explicit analysis session.
Results can depend on what remains in the chat contextAnalysis runs from explicit dataset and method state.
It may calculate from samples, summaries, or invented valuesStatistical code executes against the uploaded data.
Upload and context limits make substantial datasets awkwardThe local analysis engine processes data outside the model context, subject to device and method limits.
A fluent answer can hide missing evidenceResult explanations are constrained by structured outputs, diagnostics, and claim boundaries.
Reproducing an earlier answer is difficultCode, parameters, results, and reports can be retained and exported.
Sensitive data may be sent to an external serviceLocal/offline deployment keeps analysis inside the controlled environment.

Why not rely only on traditional statistical software?

Traditional tools are powerful, but they often begin after the hardest workflow decisions.

Traditional software frictionOfflineAI design response
Users often must already know which method to selectGuided method selection based on the research question and dataset.
Variable roles can be confusingShows the expected outcome, predictor, group, time, ID, weight, or before/after roles.
Column setup is manual and error-proneSuggests compatible columns and asks users to confirm their meaning.
Dirty or unsuitable data can produce cryptic errorsExplains missing values, wrong types, sparse groups, small samples, and other problems.
Output often assumes statistical expertiseExplains estimates, uncertainty, diagnostics, assumptions, and limitations.
Code creation is a separate skillGenerates visible, reproducible R code from confirmed bindings.
Reporting requires copying between toolsProduces a report and audit/export package from the same analysis.
Learning and execution are separatedTeaches the method while guiding the user through the workflow.

These are product design responses, not a claim that every catalog method is currently certified. Method-level claims remain bounded by current release evidence.

What it covers

The everyday analyses researchers actually run.

Grouped by what you're trying to find out — the technical names are there, but you don't need them to start.

📊

Compare groups

Is there a real difference between conditions or samples? t-tests · ANOVA · non-parametric · chi-square.

📈

Find relationships

What relates to — or predicts — your outcome? Correlation · regression · logistic regression.

🧪

Measure & validate

Is your scale measuring what you think? Reliability (Cronbach's α) · factor analysis · SEM.

🔒

Model, forecast & more — all offline

Mixed models, survival analysis, forecasting, clustering, meta-analysis, IRT and beyond — 88 distinct methods in the Research catalog, running privately on your machine.

📄

Explain output

Paste output from your own R, SPSS, or Mplus and get a plain-language explanation with its evidence and limitations visible.

Independent research

Statistical fluency is not the same as choosing the right analysis.

The NeurIPS 2024 StatQA benchmark contains 11,623 examples that test whether a model selects the relevant columns and all applicable statistical methods. Its authors reported a best representative-model result of 64.83% for GPT-4o under their protocol.

🧭

The problem it demonstrates

A confident general-purpose answer can still begin from the wrong columns or method. Read the peer-reviewed paper →

🔬

Our design response

OfflineAI separates guided method-and-column selection from deterministic statistical execution, visible code, and current-commit evidence.

📏

Honest benchmark status

StatQA integration is planned. We have not yet published an OfflineAI StatQA score. StatQA tests applicability—not numerical correctness or every possible uploaded dataset. View StatQA →

Why it's dependable

Built so a demo doesn't fall apart on real data.

88distinct Research catalog methods
4independent certification pillars
Currentcommit-bound evidence required
100%runs offline

Catalog coverage is not a certification count. Method-level claims remain limited to the exact scope and evidence shown for the deployed release.

See it with your own study.

We'll load a dataset, run a real analysis, and show you the answer and the proof — with your data never leaving the machine.