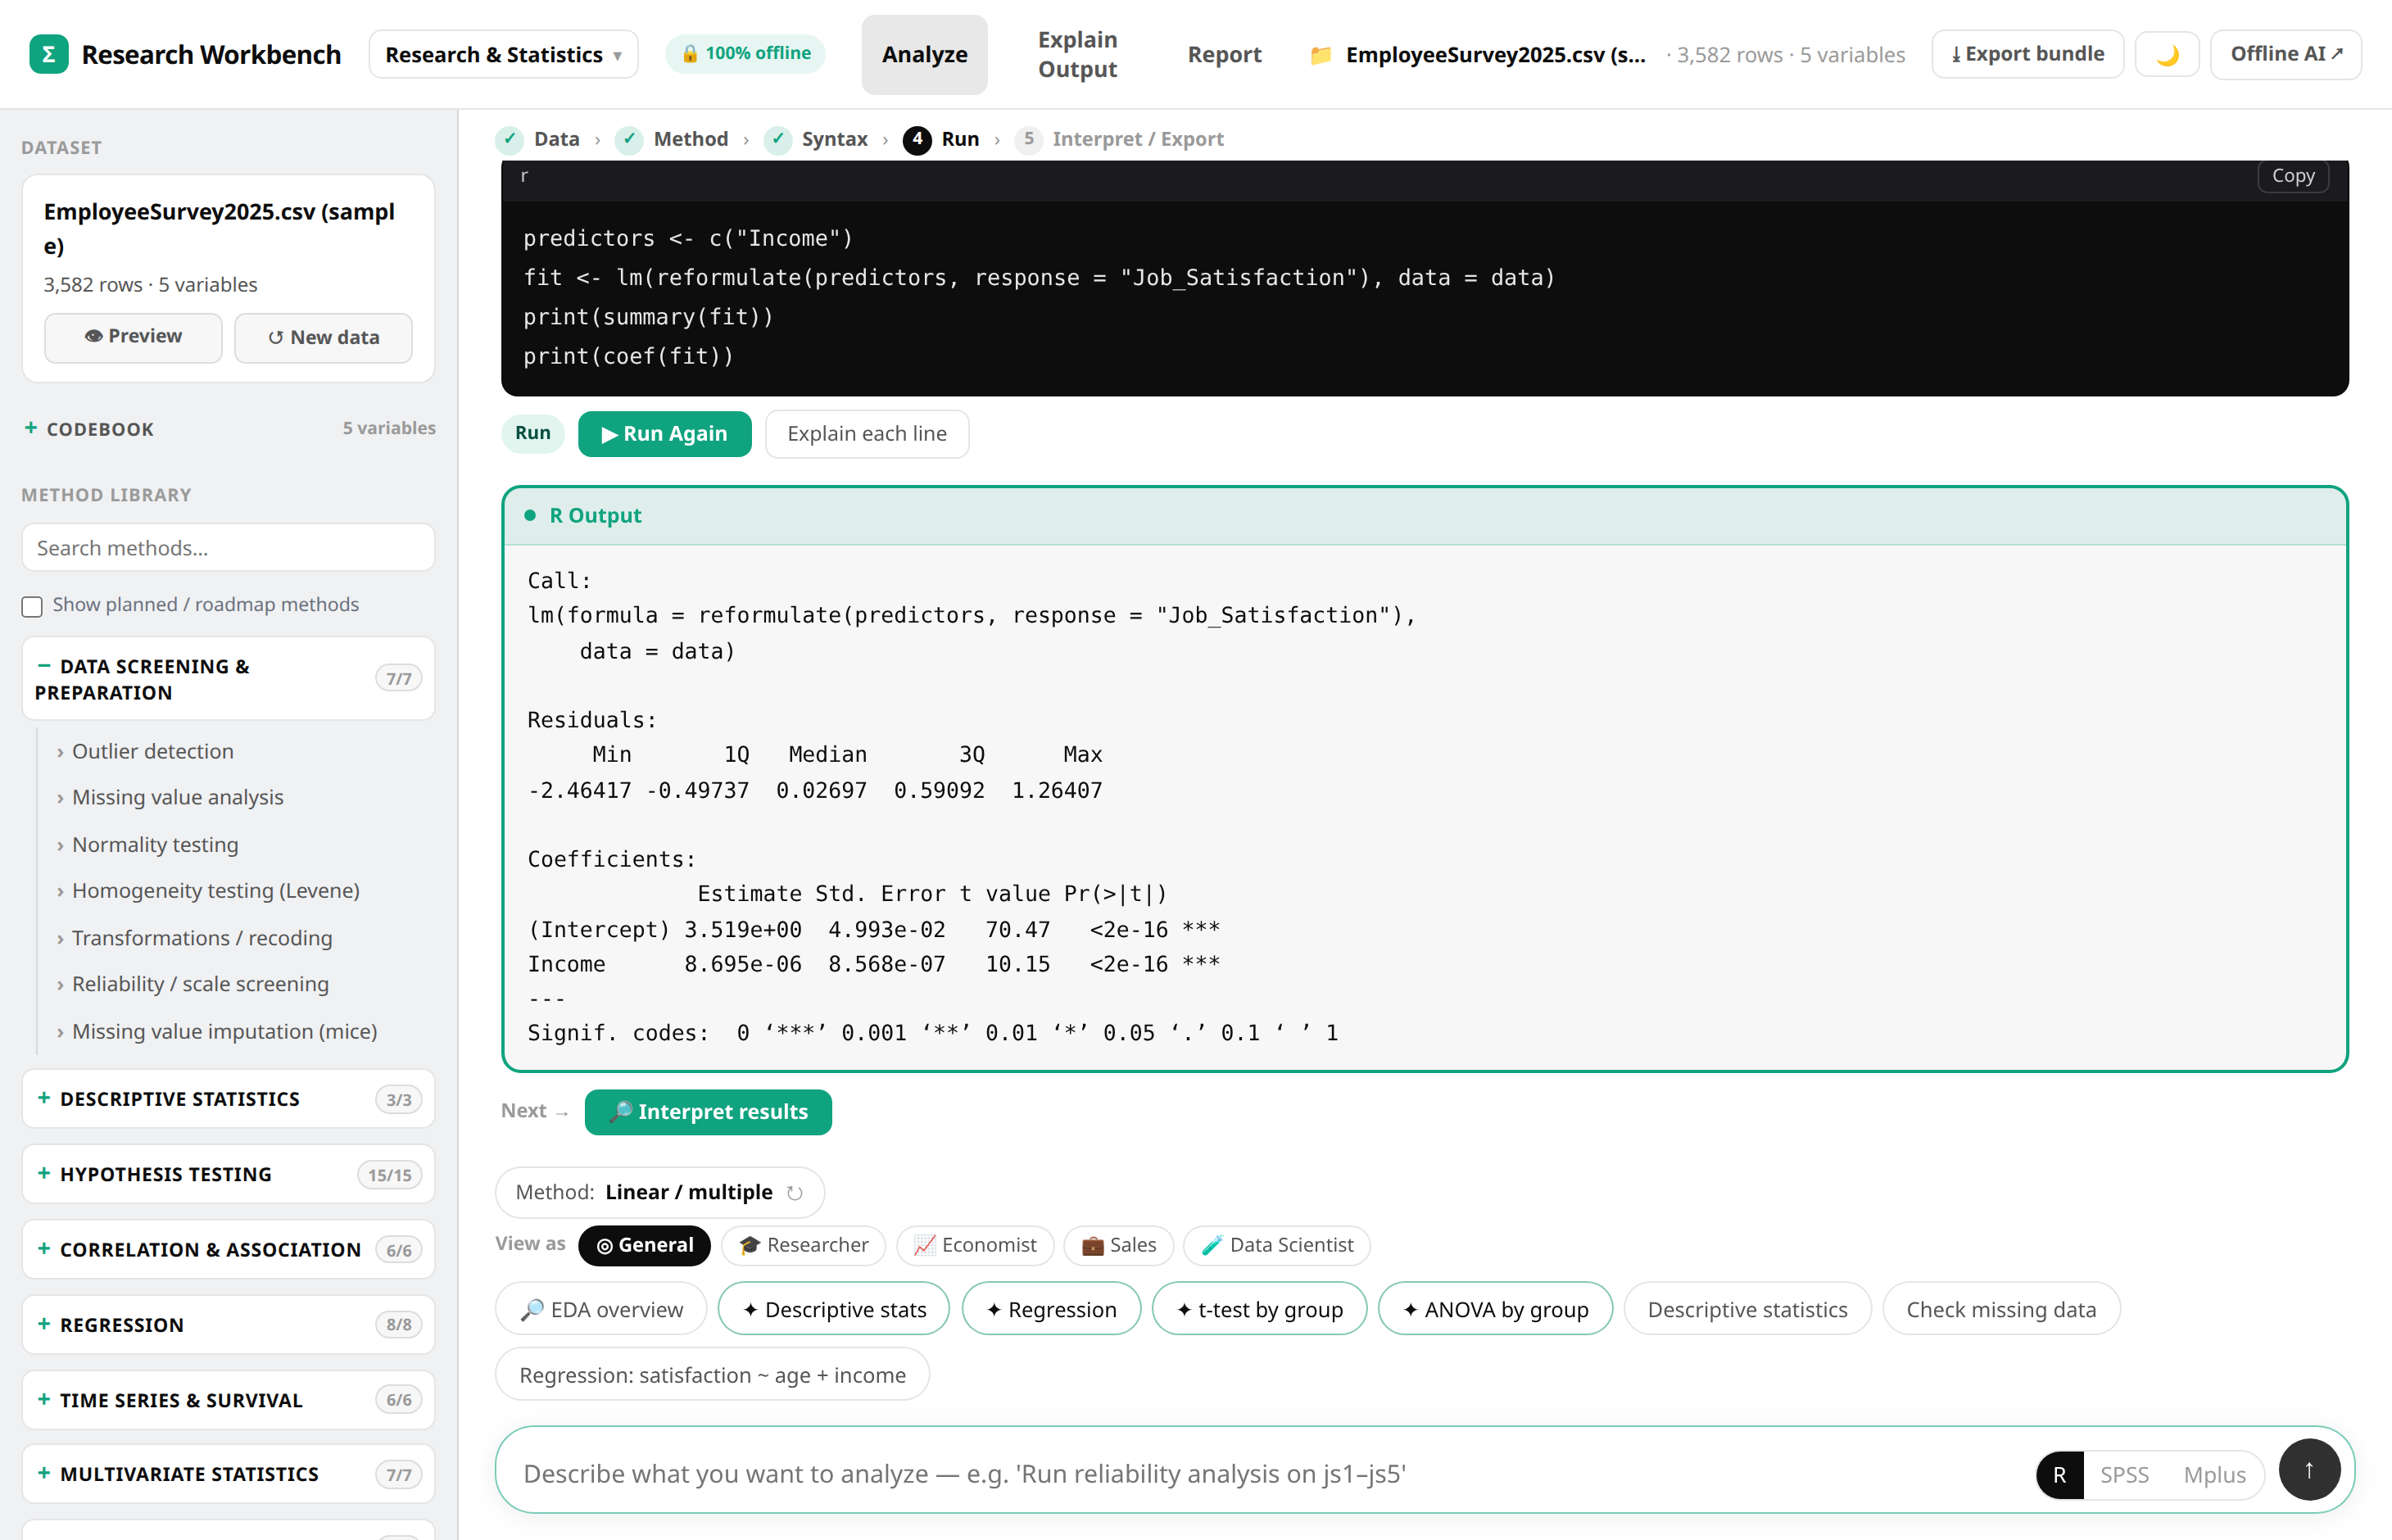
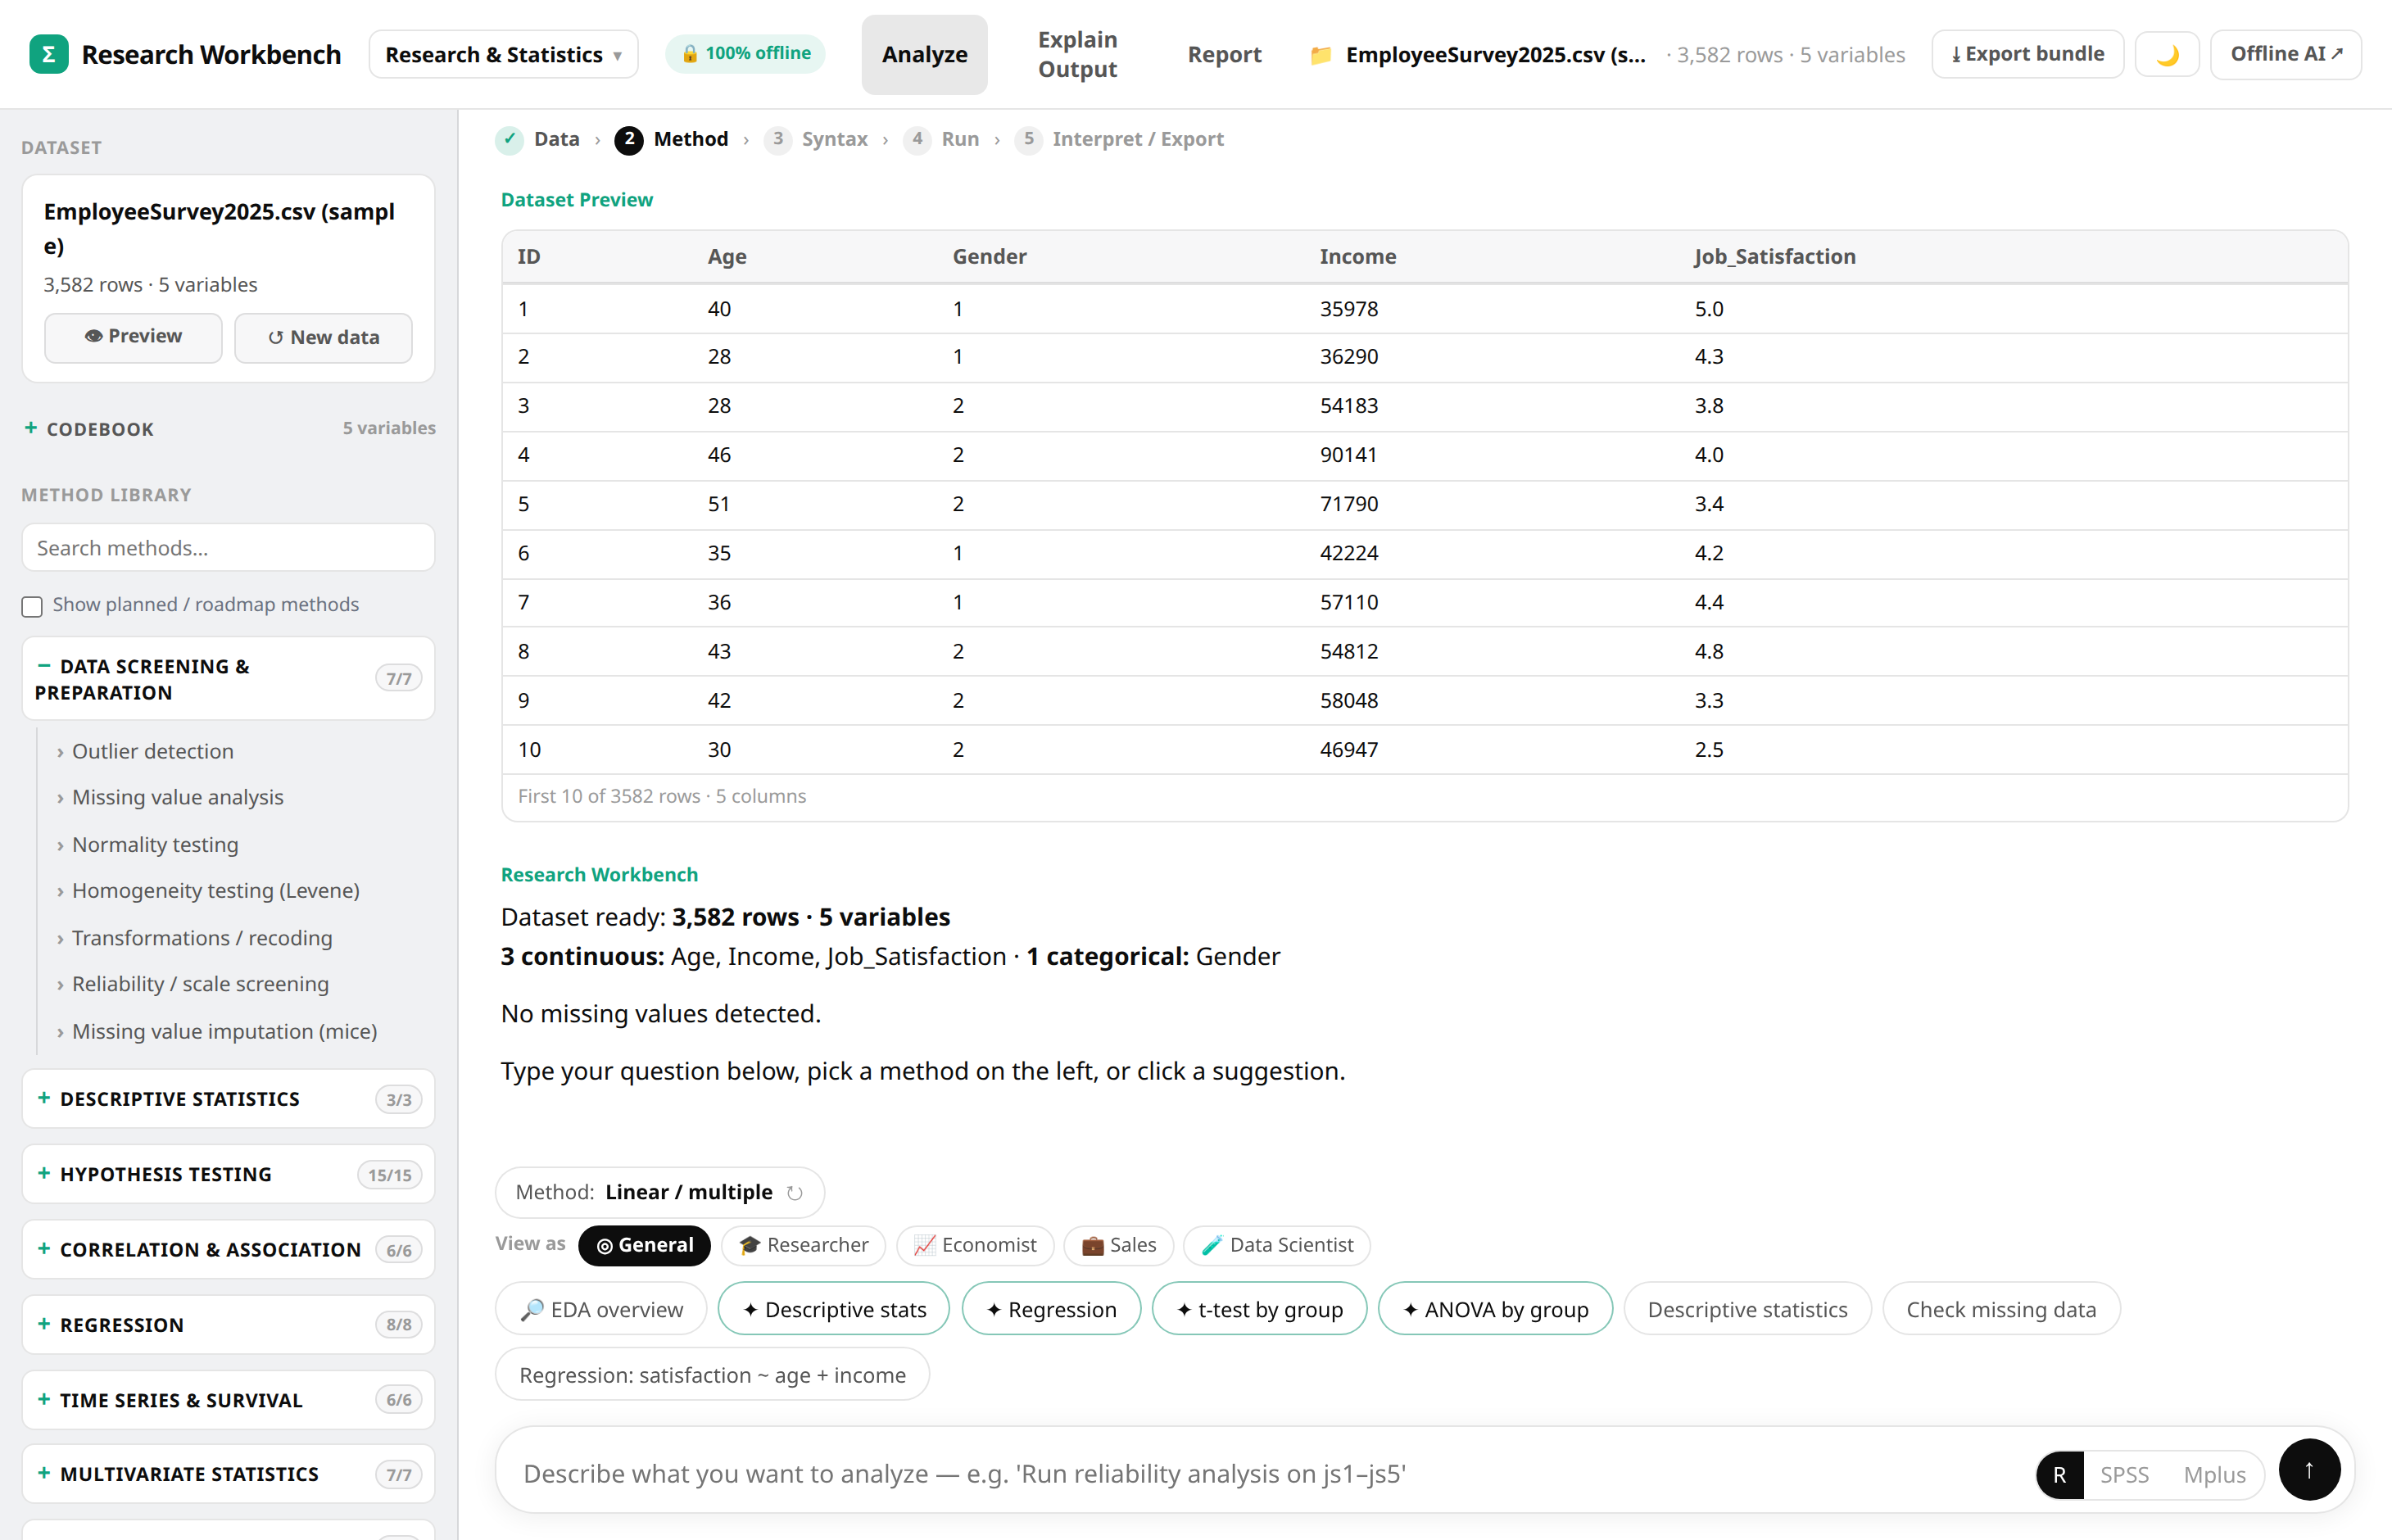
The all-in-one lab for economics & statistics courses: students upload real data, get the right method, run models in the browser, learn the theory, cite the papers, and export reproducible work — all in one place. Recommend one platform to your whole class.
From a research question to a result you can hand in.
No R installs, no Stata license, no "which test do I use?" — just the analysis.
1
Bring data
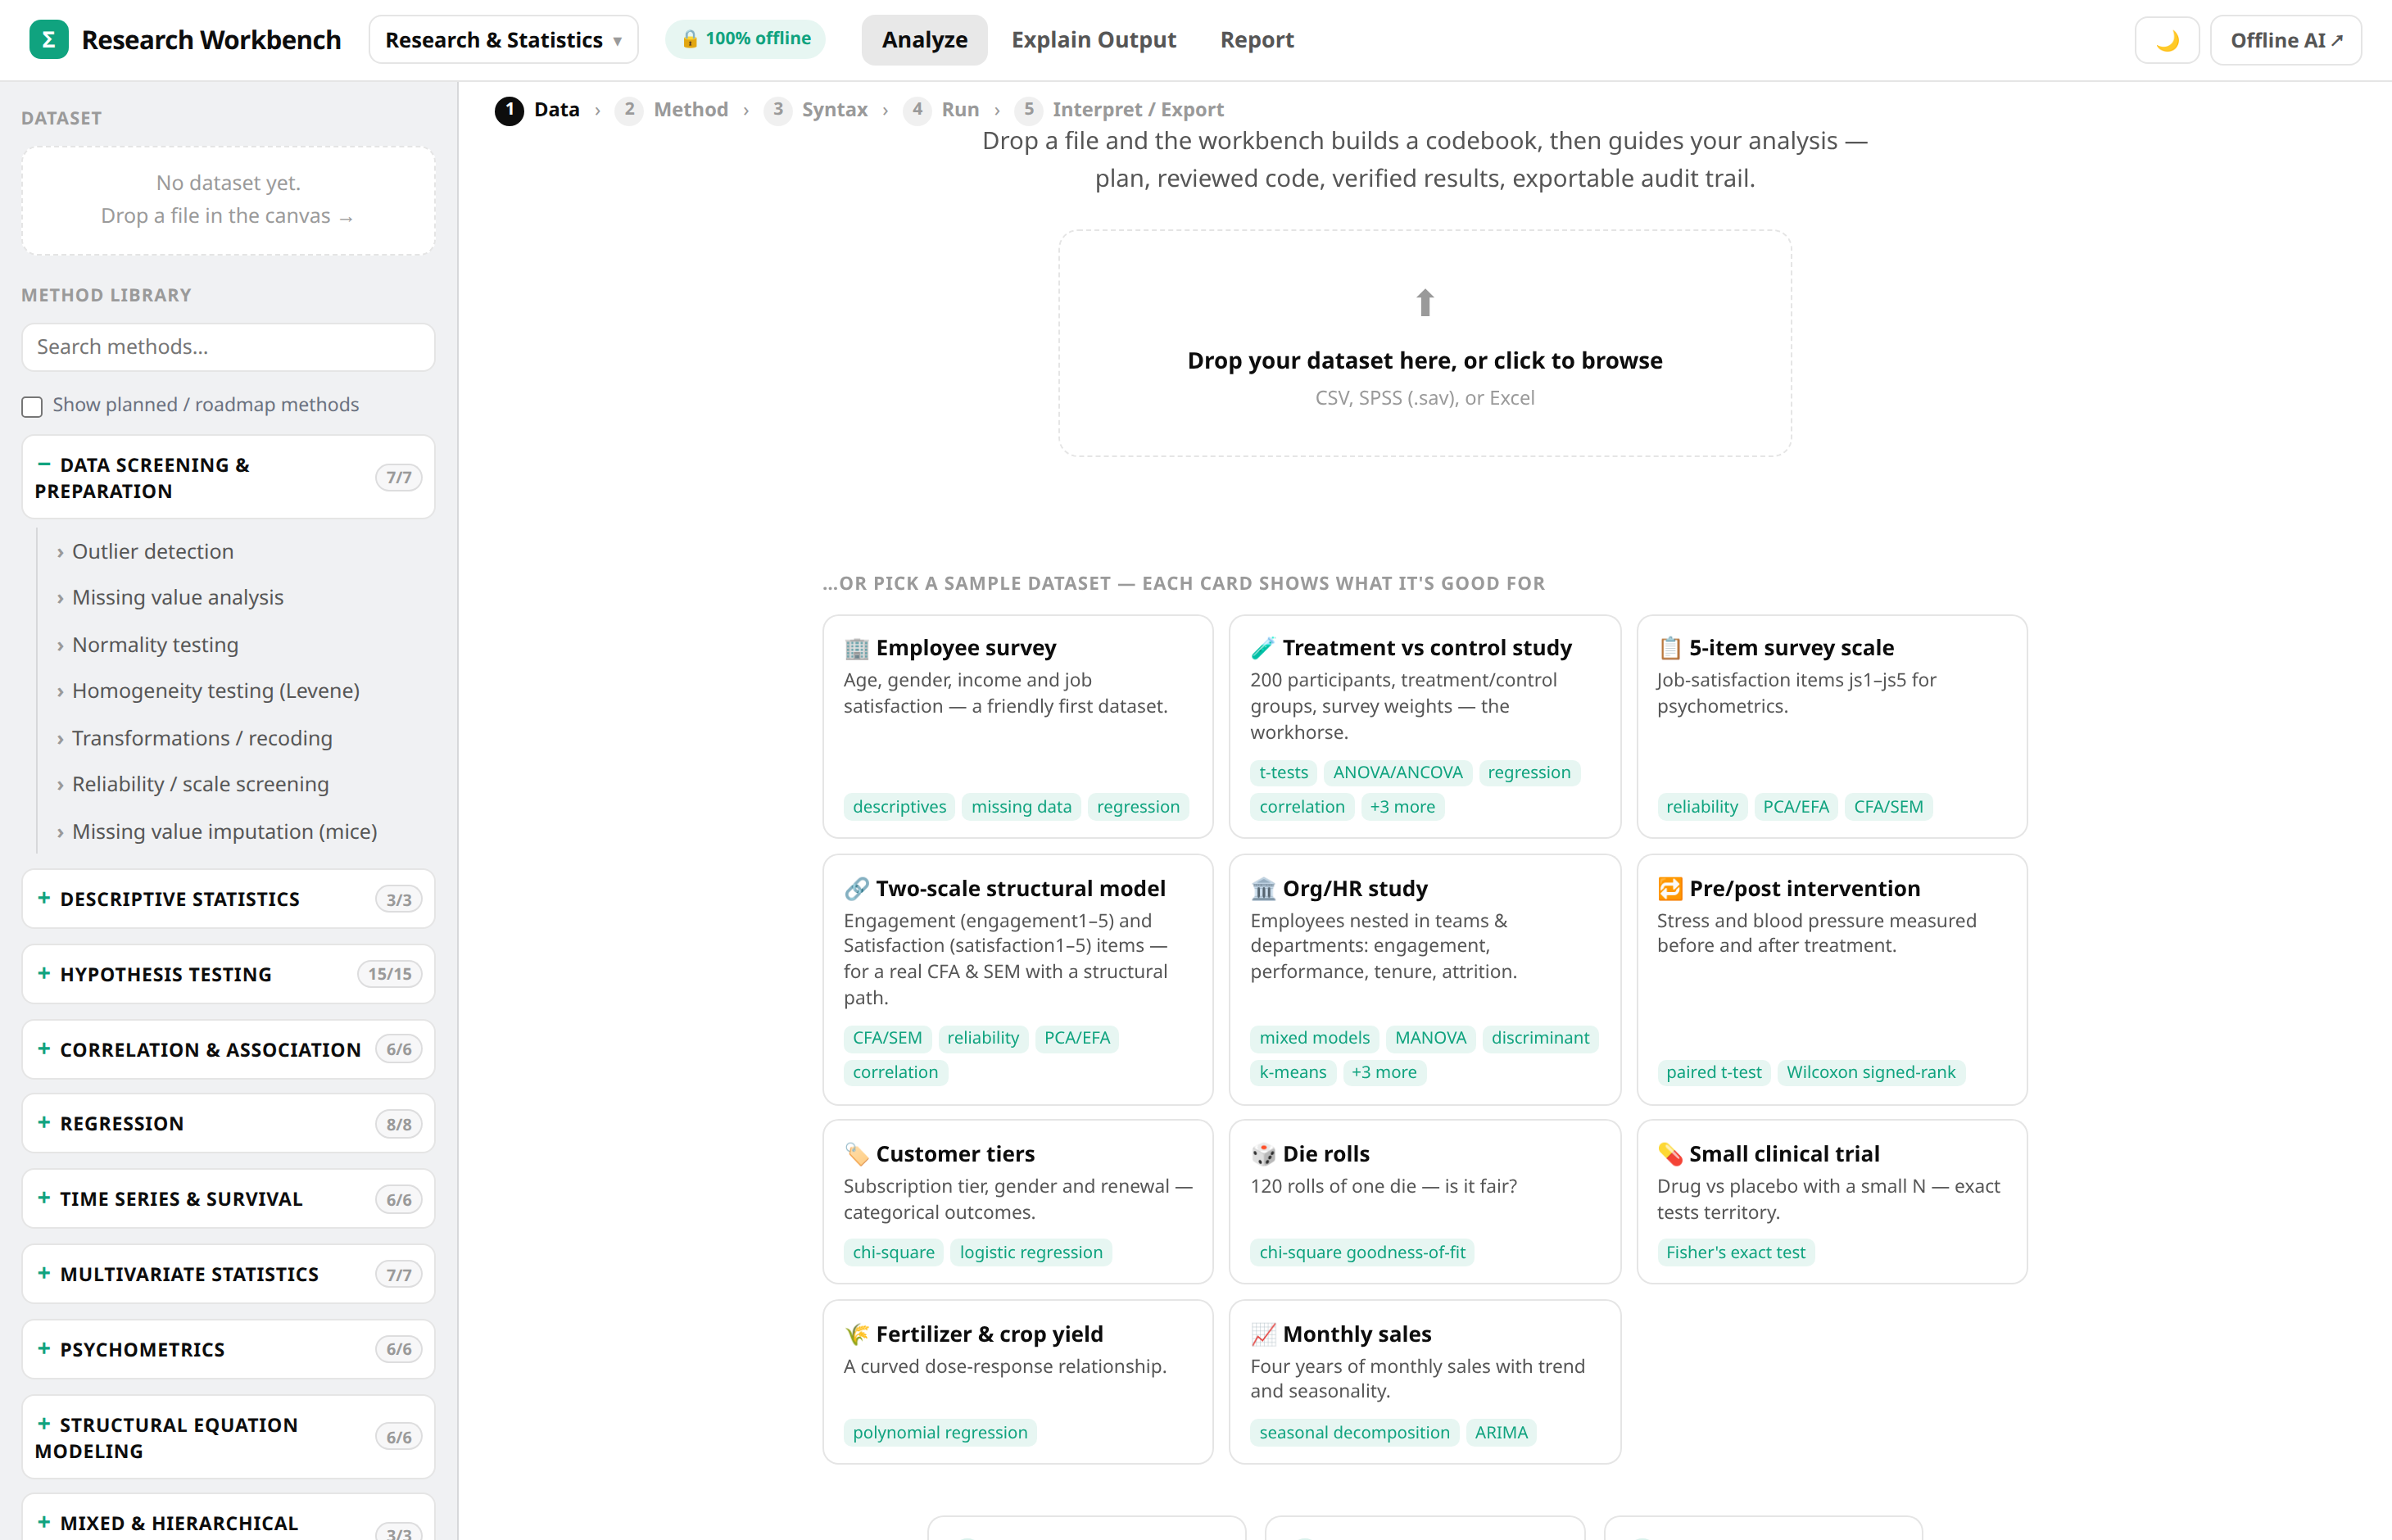
Upload your own file, or pick a built-in World Bank or IMF dataset.
2
Get the method
Describe the question; it suggests a method that actually fits your columns.
3
Run it — no setup
Real R runs on the server, in the browser. Nothing to install on the laptop.
4
Learn the theory
What the method does, its assumptions, and the mistakes to avoid.
5
Export
Code, output, tables, citations, and a reproducible bundle for the assignment.
For professors
Recommend one platform. Trust every result.
Stop losing the first two weeks of the course to "R won't install." Teach the method, not the software.
🎯
One platform for the class
Every student works in the same place — no version drift, no environment support tickets to your TA.
✅
Outputs you can trust
Every number a student turns in traces back to the code that produced it. If the data doesn't fit the method, it says so instead of inventing a result.
🔁
Reproducible assignments
Each result exports as a bundle — data, script, output, and citations — that you or a TA can re-run and get the same numbers. Grade with confidence.
📚
Teach the method, not the setup
Students spend their time on the economics — reading the assumptions, interpreting coefficients, catching the common mistakes — instead of debugging package installs. Bring your own datasets and point the whole class at them.
🏛️
Your rules
Run it hosted for the class, or entirely on your department's own machine so nothing leaves the building — your call.
No dependency hell
The laptop stops being the bottleneck.
No R packages to compile, no Python environment to fix, no Stata or SPSS license, no "not enough RAM." Students open a link and run the model — the heavy lifting happens on the server.
Nothing to install — works in the browser
Upload big files — no token or upload limits like a chatbot
Runs the same for every student in the class
Pick the right method
Type the question. It chooses the method — and teaches it.
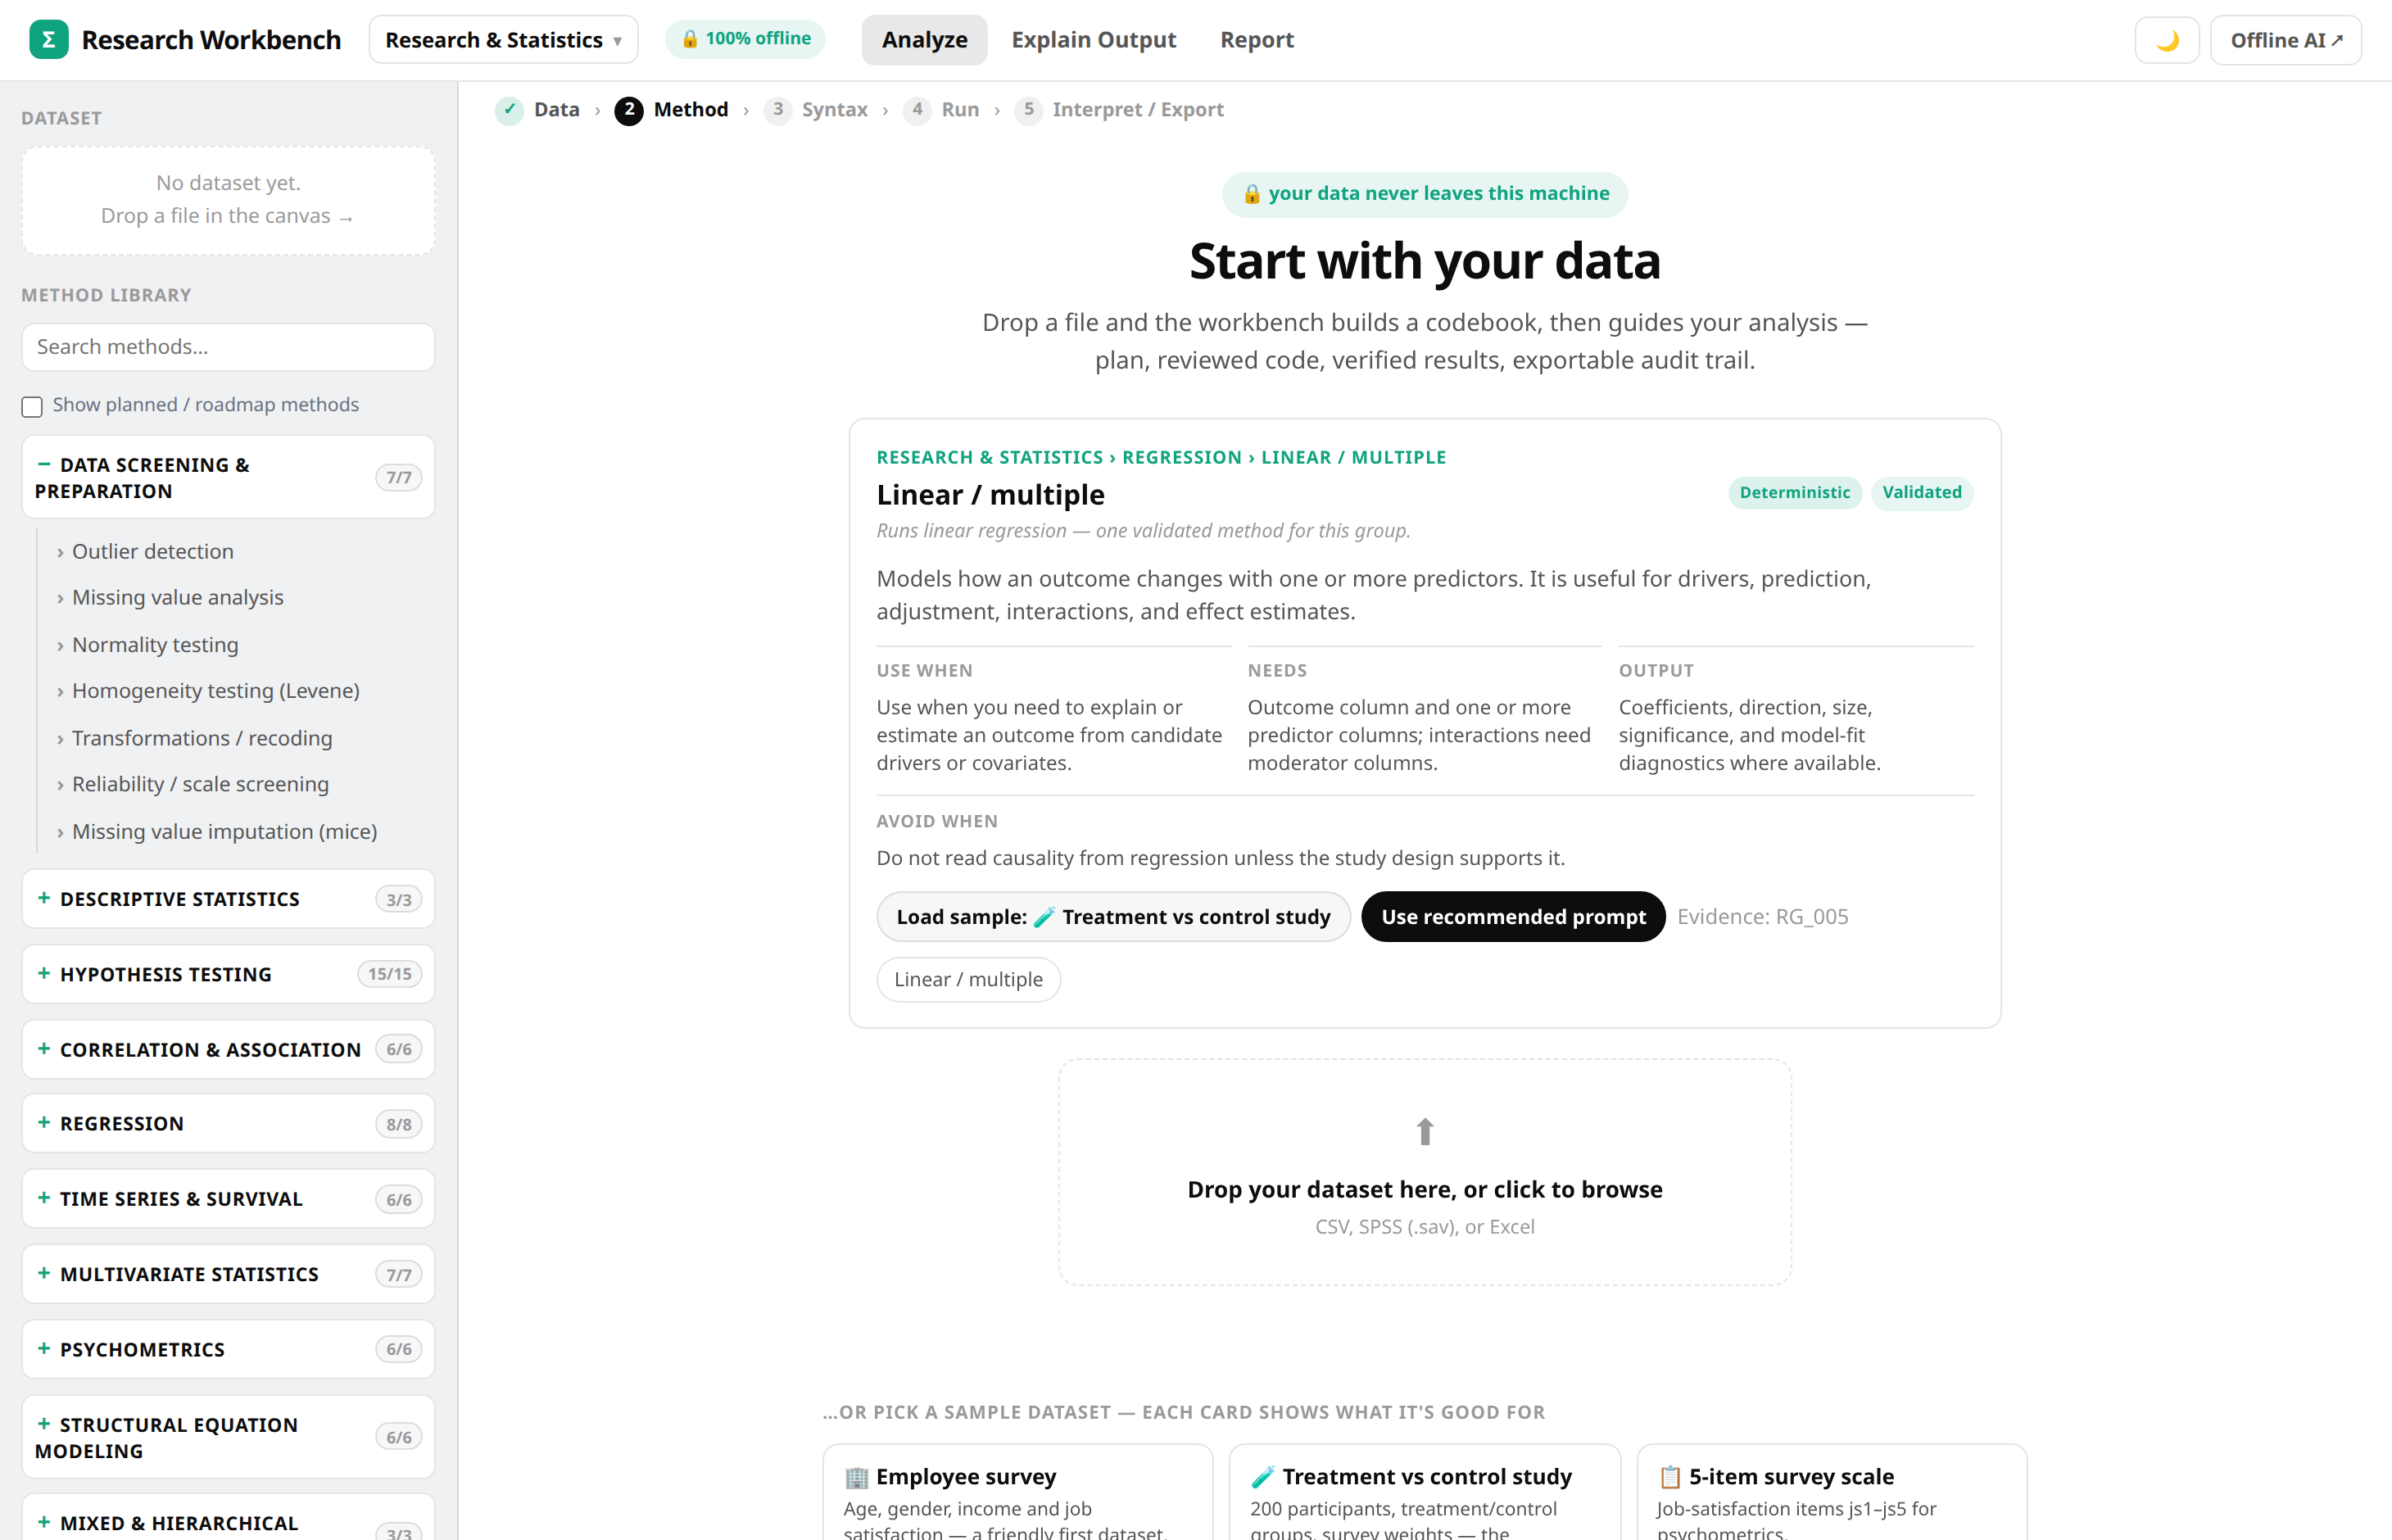
Not sure if it's fixed effects or random effects, a logit or a probit? Describe what you want to find out. The workbench suggests an approach that fits your columns, writes the R, and explains what the method does, its assumptions, and when not to use it.
A plain-language guide for every method — what it does, when to use it, what to avoid
Recommendations that match your actual data
Panel FE/RE, DiD, IV, logit/probit, time series, SEM — 100+ analyses
Real economics data built in
Come with a question, leave with a dataset.
Students who don't have data don't get stuck. Real, curated macro datasets are built in — World Bank and IMF panels ready to analyse — alongside a curated library of papers tied to each method.
World Bank & IMF datasets built in — GDP growth, inflation, unemployment, trade
Bring your own CSV, Excel, SPSS, or Stata file
A paper bank organised by method, so students learn from the literature
Trust the numbers
Answers students can check — not just believe.
Most AI tools ask you to trust them. This one shows its work: the columns it used, the code it ran, and the real output every figure came from. Unverifiable numbers are withheld, not guessed — the guarantee that makes it safe to grade.
Every number traces back to the actual computation
It shows exactly which columns filled each role before running
Export the script, output, tables, and citations to reproduce it
Data & methods
The econometrics a course actually runs.
Grouped by what you're trying to find out — the technical names are there, but a student doesn't need them to start.
📈
Regression & prediction
What drives the outcome? OLS · multiple regression · logit/probit · quantile.
🗂️
Panel & causal
Countries or firms over time. Fixed / random effects · Hausman · clustered SE · difference-in-differences.
And the rest of the toolkit — 100+ validated analyses
Instrumental-variables-style adjustment, survey weights, SEM & mediation, survival, clustering, meta-analysis and more — each writing verified code and, where you need it, matching SPSS / Mplus / Stata-style syntax for your own workflow.
📄
Explain output
Paste output from your own R, Stata, SPSS, or Mplus and get a plain-language explanation you can trust.
Why it's dependable
Built so it doesn't fall apart on real student data.
Offline and on-prem when you need it — a trust layer under everything, not a marketing line.
100+validated analyses
1,290reliability checks
0crashes in the latest run
100%can run offline / on-prem
See it with your own course dataset.
We'll load a dataset, run a real analysis, and show you the answer, the proof, and the reproducible export — the exact flow your students would use.